
A rebalancing market: more homes, more movement — but more pressure too.
As we move into April, Niagara’s real estate landscape is shifting in a big way. March brought a strong resurgence in new listings and solid sales activity across several markets. But despite the rising number of transactions, prices in most cities edged downward, and homes are taking longer to sell than they were at this time last year.
This isn’t a volatile market — but it is one that’s cooling into balance. For sellers, the playing field is more competitive. For buyers, there’s more breathing room, more choice, and less pressure.
Let’s dive into what’s really happening.
🔍 Year-Over-Year Market Trends (March 2024 vs. March 2025)
1. Inventory Is Up Sharply — But Demand Isn’t Fully Catching Up
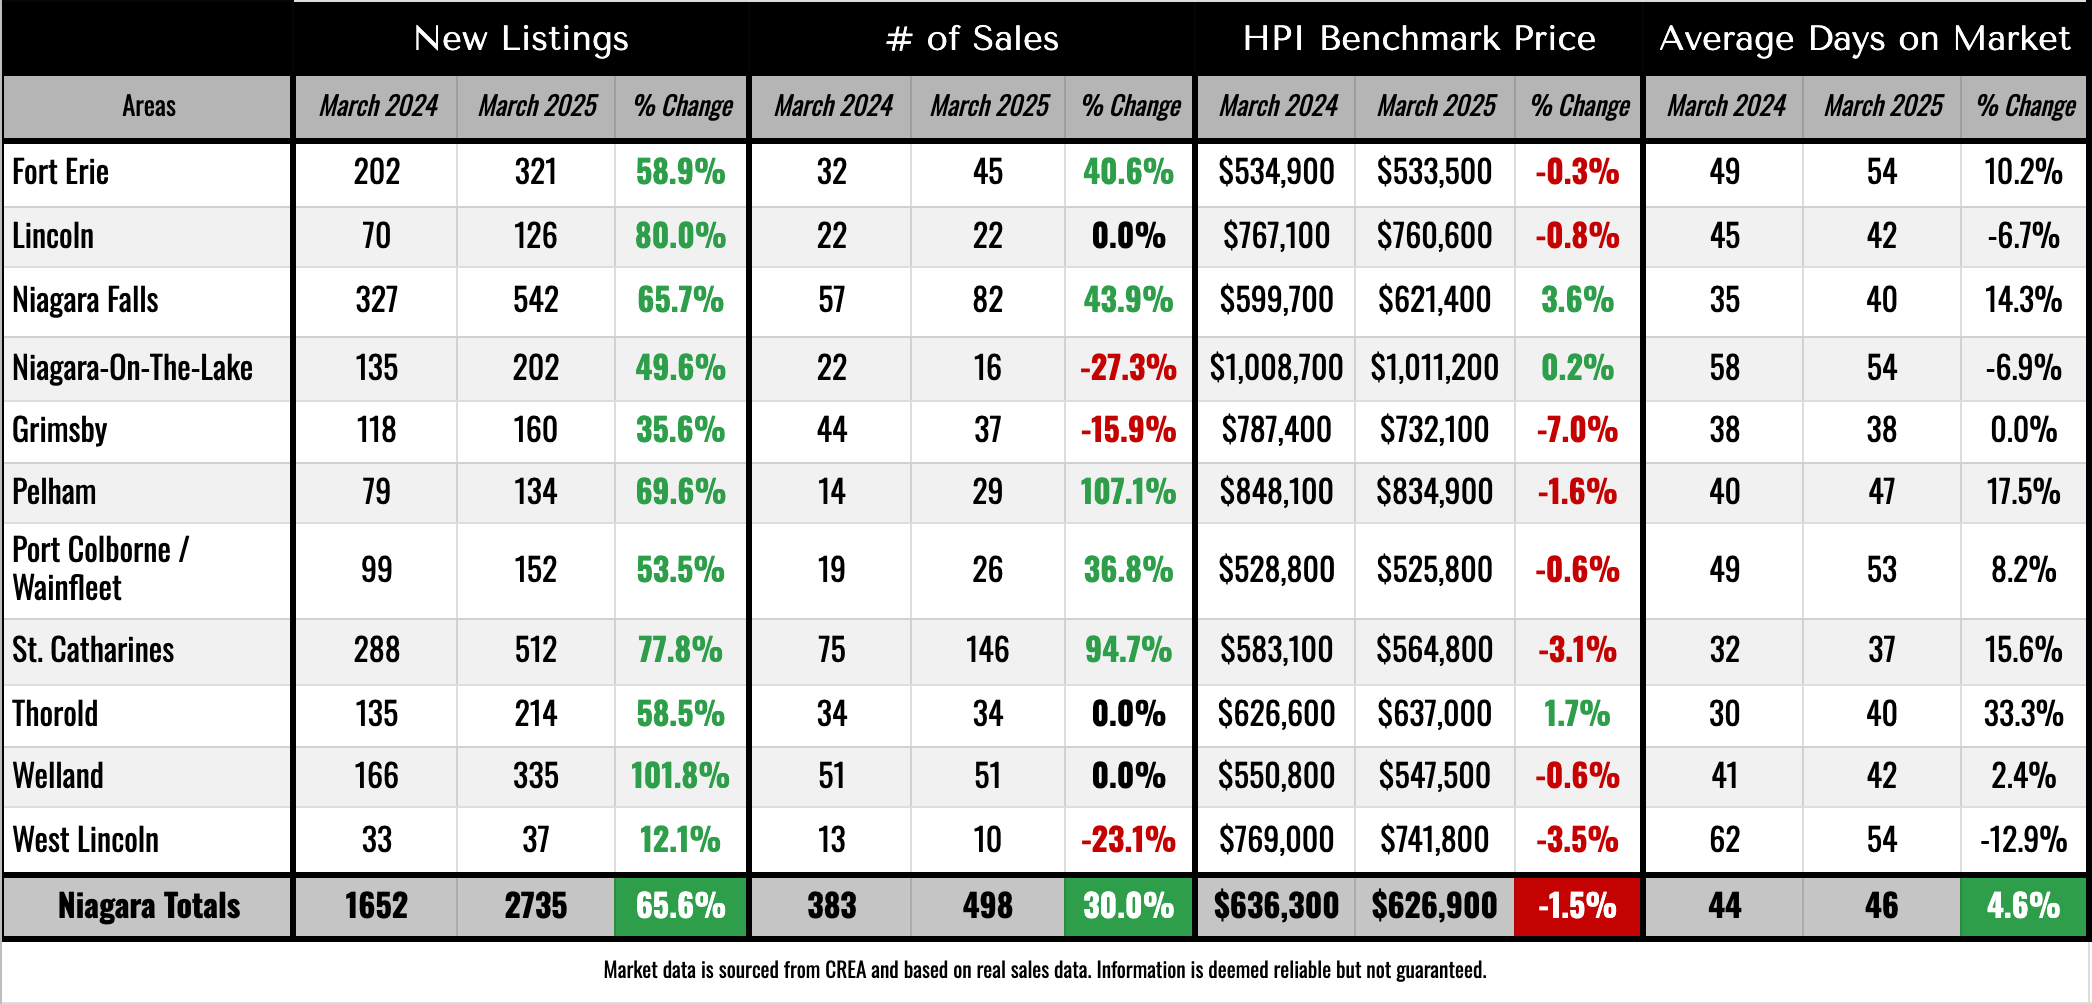
March saw 2,735 new listings hit the market across Niagara — a 65.6% increase compared to just 1,652 in March 2024. This is the second straight month of major inventory expansion and reflects a clear return of seller confidence (or necessity). People are listing — and in large numbers.
But while buyer activity has also picked up, it’s not matching the flood of listings. Sales rose 30.0%, from 383 last year to 498 this March — a strong number, but well short of the increase in inventory.
📈 Biggest year-over-year increase in listings:
Welland: +101.8%
St. Catharines: +77.8%
Pelham: +69.6%
Thorold: +58.5%
Fort Erie: +58.9%
🏡 Strongest growth in sales:
Pelham: +107.1%
St. Catharines: +94.7%
Grimsby: +105.3%
Niagara Falls: +43.9%
Port Colborne / Wainfleet: +36.8%
📉 Cities where sales declined:
Niagara-on-the-Lake: -27.3%
West Lincoln: -23.1%
What this means:
Increased inventory is giving buyers more selection — which is great for the market overall. But it’s also starting to tilt conditions in the buyer’s favour. That’s especially true in higher-priced or slower-moving markets, where demand simply isn’t keeping up. The result? Pressure on sellers to be sharp with pricing and marketing.
💵 Price Trends: Softness Across Most Markets
The regional benchmark price fell 1.5% year-over-year, from $636,300 to $626,900. That’s not a huge drop, but it’s meaningful — and part of a three-month trend.
The story here is local. Some markets are holding their ground or even appreciating slightly. Others are starting to correct, particularly where listing growth has been sharpest.
📉 Notable price declines:
🔻 Grimsby: -7.0%
🔻 West Lincoln: -3.5%
🔻 St. Catharines: -3.1%
🔻 Pelham: -1.6%
🔻 Lincoln / Welland / Port Colborne: all down 0.6–0.8%
📈 Minor price growth:
🟢 Niagara Falls: +3.6%
🟢 Thorold: +1.7%
🟢 Niagara-on-the-Lake: +0.2%
🟢 Fort Erie: -0.3% (holding relatively steady)
What this means:
This is classic price resistance. Buyers aren’t overbidding. There’s more room to negotiate. Pricing is soft — not collapsing — but trending downward in most areas. Cities like Niagara Falls and Thorold continue to hold stronger, likely due to accessibility, affordability, and steady demand.
⏳ Time on Market: Homes Are Sitting Longer — Unless They’re Dialed In
The average days on market (DOM) increased by 4.6%, rising from 44 days last March to 46 days this year. While not a massive shift, it tells the story of changing momentum.
Buyers are taking longer to decide. They have more homes to choose from, and urgency has faded. Homes that don’t check the right boxes — price, condition, location — are sitting longer.
📈 Cities with the biggest DOM increase:
Thorold: 30 → 40 days (+33.3%)
Pelham: 40 → 47 days (+17.5%)
St. Catharines: 32 → 37 days (+15.6%)
📉 Cities where homes are selling faster than last year:
West Lincoln: 62 → 54 days (-12.9%)
Niagara-on-the-Lake: 58 → 54 days (-6.9%)
Lincoln: 45 → 42 days (-6.7%)
What this means:
The DOM increase, even though it’s moderate, reinforces that buyers have the upper hand. They’re shopping more carefully, comparing more homes, and waiting for value. In premium or niche markets like NOTL, however, well-priced homes can still sell quickly — especially when inventory is limited.
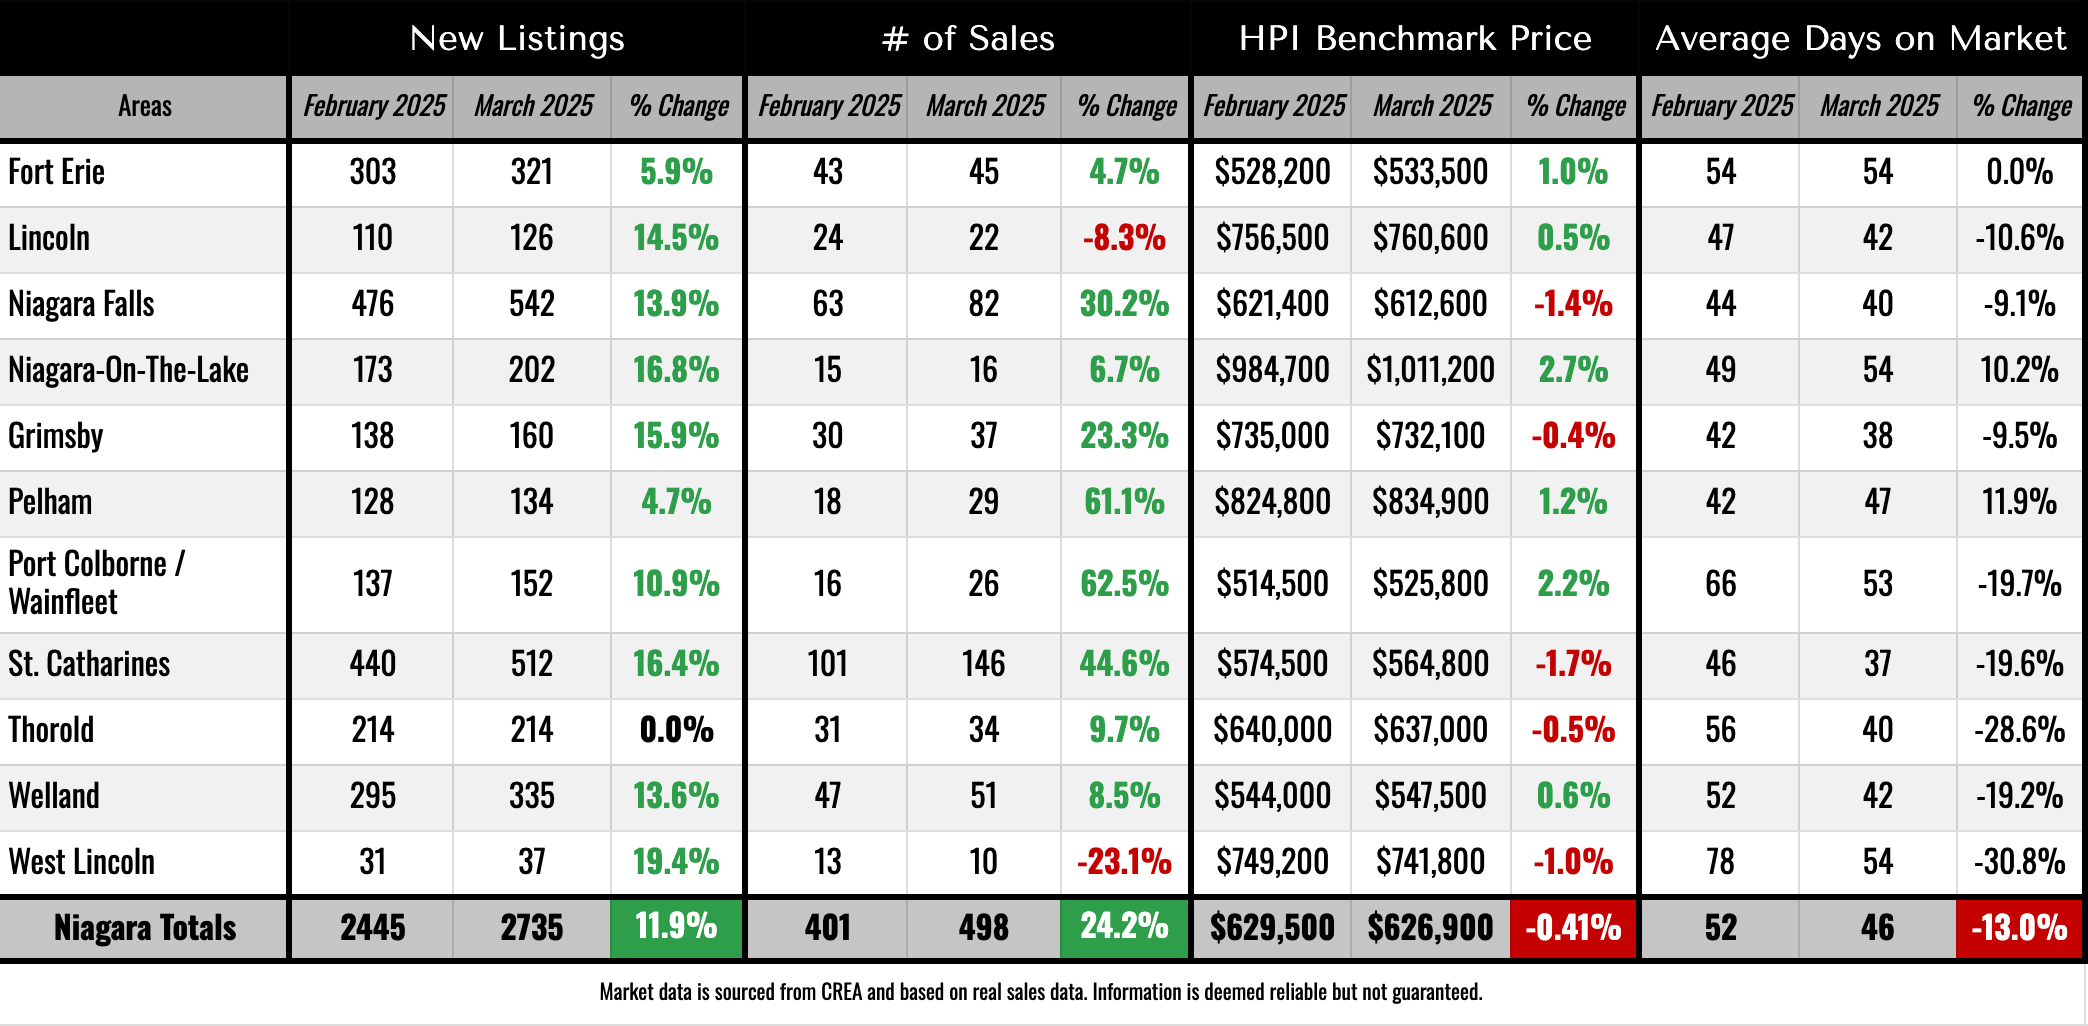
📊 Month-over-Month (February 2025 vs. March 2025)
Here’s what changed over just the past month:
New listings: ↑ 11.9%
Sales: ↑ 24.2%
Benchmark price: ↓ 0.41%
Average DOM: ↓ 13.0% (from 52 to 46 days)
What this means:
Seasonal momentum is building. Buyers came out stronger in March than February — and listings followed suit. Homes are moving slightly faster than last month, but prices continued to edge down, suggesting there’s still more supply than urgency.
🎯 What Buyers and Sellers Need to Know
For Sellers:
The market has changed — and buyers know it.
Overpricing will hurt more now than ever.
If you want to sell quickly and near asking, you must price right, present well, and be flexible.
Homes are still selling — but the "wait-and-see" approach isn’t working like it did in 2021.
For Buyers:
You finally have options — and time.
The data shows prices are trending downward across most of the region.
There's room to negotiate, especially on homes that have been sitting.
If you’re waiting for a crash — it’s not happening, but you are in a more favourable position than a year ago.
Final Thoughts
The Niagara real estate market is in a state of balance — not falling apart, but not soaring either. Sellers are active. Buyers are back. But neither side has full control.
This market rewards preparation, strategy, and realism.
If sales continue to rise into Q2 and inventory stabilizes, prices may level off. If listings continue to outpace demand, we may see more downward pressure heading into late spring. Either way, we’re firmly out of the high-stakes, FOMO-driven market of 2021–2022.
Instead, we’re in something more grounded — and more negotiable.